Housing Affordability, Demand and Future Housing Values
The National Policy Statement on Urban Development (NPS-UD) has upped the ante for councils to meet the assessment and reporting requirements. At M.E we have been working hard to bring down that ante, focusing on smarter methods plus economies of scale and scope to help meet the requirements in more cost-effective and quicker ways.
While the new NPS retains many requirements from the previous NPS-UDC, it also imposes some sharper edges, especially around the economic aspects, the making sure that planning decisions support market competitiveness. Helpfully, almost all of the development and learning for the previous NPS-UDC can be used and built on for this NPS-UD, and that has been complemented with some substantial R and D work into urban economies, housing and land markets, property development, feasibility, and price trends, plus some investment into extensive datasets on property, prices, business activity, and construction. We have had some time (while waiting for some of the big data) to put that extra learning into better assessment tools. And as luck would have it, closely following the new NPS-UD has been the finalised Census 2018 results, its major customised datasets largely completing the evidence base for those platforms.
The NPS-UD does have some new complexities, but going forward we expect a bit of ‘pick and mix’ from the Tier 1 and Tier 2 councils, to utilise the updates of the proven methods for housing demand, feasibility and affordability, and also access specialised support on key matters - particularly the monitoring, economics, and land market efficiency aspects, and to establish how their planning provisions may influence the efficiency of land and development markets going forward.
In this M.emo, we describe the enhanced platforms which cover three specialised aspects – housing affordability, future housing values, and the ethnicity-income-tenure patterns in housing demand.
Housing Affordability
At Platform 1 sits M.E’s Housing Affordability Model, with our recommended approach to evaluate housing affordability to satisfy the compliance requirements.
Much has been written on housing affordability, and it remains a key subject for social policy and wider economic research. It sits as Objective 2 in the NPS-UD, complemented via the Implementation clauses. The primary purpose of the NPS itself is to bring down the value of urban land to make housing more affordable, by requiring council plans to comply with the NPS-UD provisions.
M.E have focused on what Tier 1 and Tier 2 councils need to know, and need to show, in order to achieve compliance. That is not to pretend that councils’ compliance will solve all housing affordability issues. But it is important to be able to show whether council planning policies will contribute positively to broader affordability objectives and will not exacerbate affordability challenges.
The Model is a tool which accurately identifies the nature and the dimensions of housing affordability, and brings together the demand side and the supply side of affordability, now and into the future. It shows the current affordability situation, what is likely to be needed over the NPS-UD time horizons, and what housing supply is potentially available to meet that need.
The demand side is informed by well-established models identifying demand for housing and affordable housing. It focuses on numbers of non-owner households (especially but not solely), their demography and socio-economic circumstances and ability to access and service finance, to identify what value of dwelling they may afford to own or rent. We use customised Census datasets to identify numbers and understand the inter-relationships between households – by demography, ethnicity, and income – and dwelling ownership or rental, by dwelling type. This is done at city and district level, and reinforced with other customised datasets on income levels and trends, to show how circumstances change. The future situation is examined from demographic projections to track the changes in household mix, and economic projections to account for real income growth.
The supply side has always been the more challenging aspect of affordability. The core task is to understand the size and nature of the ‘affordable’ estate in each location, to make that critical comparison between the numbers of dwellings in each value band, and the number of non-owner households who would be able to afford those bands. The affordability picture has often been muddled by the media fixation on coarse indicators like the median-multiple to compare the median dwelling price with the median income. We have found that examining the picture in a bit more detail can offer a more nuanced and accurate picture. Analysis needs to consider the non-owning households, take account of the range of housing values not just the median, and examine whether households in each income band may afford dwellings in each value percentile – for instance, whether households in the lower-middle income bands could afford dwellings at the 15th value percentile, or at the 30th value percentile, and how many dwellings there are in those value bands. That detail provides a far better idea of affordability by looking at the demand and supply sides together.
And it is important to understand the affordability of the future dwelling estate, taking account of new builds and their future costs, the trends in the value of the land and the built dwellings, as well as the value shifts as the existing estate and the new estate age.
Knowing this, M.E has put in big effort to develop the methodology to solve those challenges - otherwise we wouldn’t have had much to write about. The Housing Affordability Model brings together the demand for affordable dwellings and the potential supply in the property estate, and it does this for the current situation and the future situations for the NPS-UD horizons – short, medium, and long terms. It provides a sound estimate of any current and future shortfalls in housing supply in each value band – to meet a key NPS-UD requirement.
The three graphs below show how the Model brings together the demand and supply aspects, using Far North District as an example. The first one shows the numbers of non-owner households in each income band, and at what positions in the housing market (value percentiles) those households might afford to own a dwelling. The second graph shows what those percentiles are in housing price terms ($,000).
Thus, Far North households earning $20-30,000 annually may afford a dwelling up to the 5th value percentile or $140,000 – i.e., the lowest 5% of dwellings by value in the District.
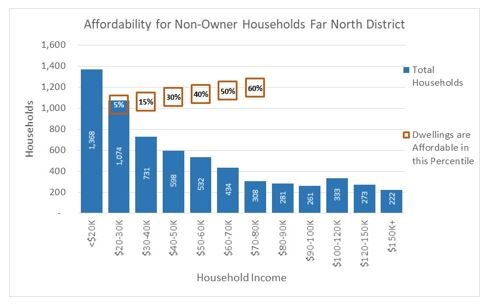
Households earning $30-40,000 may afford a dwelling up to the 15th percentile, while those earning $40-50,000 may afford a dwelling up to the 30th percentile in the District, around $270,000. Non-owner households in the lowest income band cannot afford to purchase dwellings even in the District’s lowest value band.

The third graph shows which types of household make up each income band. For example, those households in the $40-50,000 income band able to afford up to the 30th percentile which are single persons, couples, family households and so on. It also shows the types of household in the lowest income band, not able to afford even the lowest value dwellings in Far North District.

Putting numbers to the graphics, the new Model gives us a fairly comprehensive assessment of housing affordability for any territorial authority. And bringing on board the likely future housing supply, it allows us to examine likely shifts in the affordability situation into the long term.
Future Housing Values
At Platform 2 sits another tool, the Housing Price Model. This too informs the affordability issue, to provide information on the likely distribution of dwelling values at key points in the future. That is especially important for examining future affordability and how the mix of construction cost trends, land value trends, and improvement value trends can be expected to influence the prices of dwellings in the future.
There are some real gains here. A common approach in NPS-UDC and other studies was to examine new dwelling price trends for land and construction costs, and simply project those forward at current or historic rates. A number of studies indicated substantial growth in future new dwelling prices including studies (such as the OECD study of Auckland from a couple of months back) which appear to overstate future dwelling prices.
Rather than assume that all dwellings to be built over the next 30 years will be built at 2050 prices, the Model allows for the future additions to be progressively built over the period, with dwellings built in 2021 at 2021 prices, those built in 2022 at 2022 prices, and so on. As well as that fairly obvious adjustment, the Housing Price Model draws on key trends in the New Zealand residential property market to provide a better indication of the likely price structures in 3, 10 and 30 years’ time. It allows for land values and improvement values to change at quite different rates, an important characteristic of the housing market, as well as being a key driver of redevelopment feasibility.
Also, the New Zealand evidence points to land value increasing much faster than improvement values, and in line with growth in market size as cities expand, together with exogenous influences, and the demand-supply situation. The value of improvements on the land – mainly a dwelling – typically shows a different pattern of change, increasing at a significantly slower rate than land value, and often remaining static or decreasing in real terms, as built improvements depreciate. It is important to allow for these trends when assessing likely future values of the existing residential estate, as well as the new builds in the short, medium and long term horizons of the NPS-UD. M.E has invested considerably in a dataset to investigate these patterns, to provide a sound basis for estimating the likely ranges of future dwelling values, and how these will compare with what future households may afford.
Some first results are shown below, for Auckland and Tauranga over the 2000-2017/18 period. In both cities, on established residential properties, land values have increased substantially faster than improvement values – in Auckland by 6 times, in Tauranga by around 3 times. The graphs also show clearly the big impact on land prices of the pre-GFC buying boom, when the very rapid growth in prices across the country saw almost all the gain attributed to the value of the land (since the houses themselves had not changed), which significantly altered the economics of new housing, especially in Auckland.

These key patterns for each city are an important part of our models of future prices, for existing and future dwellings.
That final housing sufficiency comparison (indicative graph below) of numbers of dwellings in each value band - as against numbers of households with sufficient income to afford that value band (red line) - is a critical indicator of the future affordability of the dwelling estates in the Tier 1 and Tier 2 cities.

Housing Demand Model
At Platform 3 sits M.E’s Housing Demand Model, with our recommended approach to assessing housing demand and evaluating sufficiency of development capacity.
The established demand model worked well for the NPS-UDC, showing the size and structure of demand in terms of households by type, size, demography and income, distinguishing also owners from renters, and the types of dwellings occupied – all key aspects required by the NPS-UDC. The M.E model went further, to link household types with dwelling value bands and show which types of household occupied dwellings in higher, middle and lower value bands.
The new NPS-UD seeks detail as well on households’ ethnicity. From our customised Census datasets we have added this dimension to the 2020 Housing Demand Model. That allows us to examine key patterns, including how dwelling ownership varies by income and household type and ethnicity, and it has added another dimension to housing affordability. It is also clear that household incomes vary considerably across the Tier 1 and Tier 2 cities, and we have accessed further data on household income deciles for each.
Closing Comment
The NPS-UD has definitely upped the ante for councils to meet the assessment and reporting requirements. This M.emo has introduced three of our new ‘smart’ platforms to support NPS-UD compliance, which draw on our R and D efforts and the latest data.
The ante has also been significantly upped with the requirements to examine the competitive markets criteria which are hard-wired into Objective 2, Policy 1d and Clause 3.23.
The three platforms covered here will be very useful for councils to show compliance per se, and with the competitive markets provisions.
In our next M.emo, we describe how we are addressing the challenges which arise from those extended economic aspects of the NPS-UD, to consider both those matters of efficiency in land and development markets, and especially around what is likely to be the biggest challenge - to show whether and how city plan provisions are likely to influence those market efficiencies, going forward.